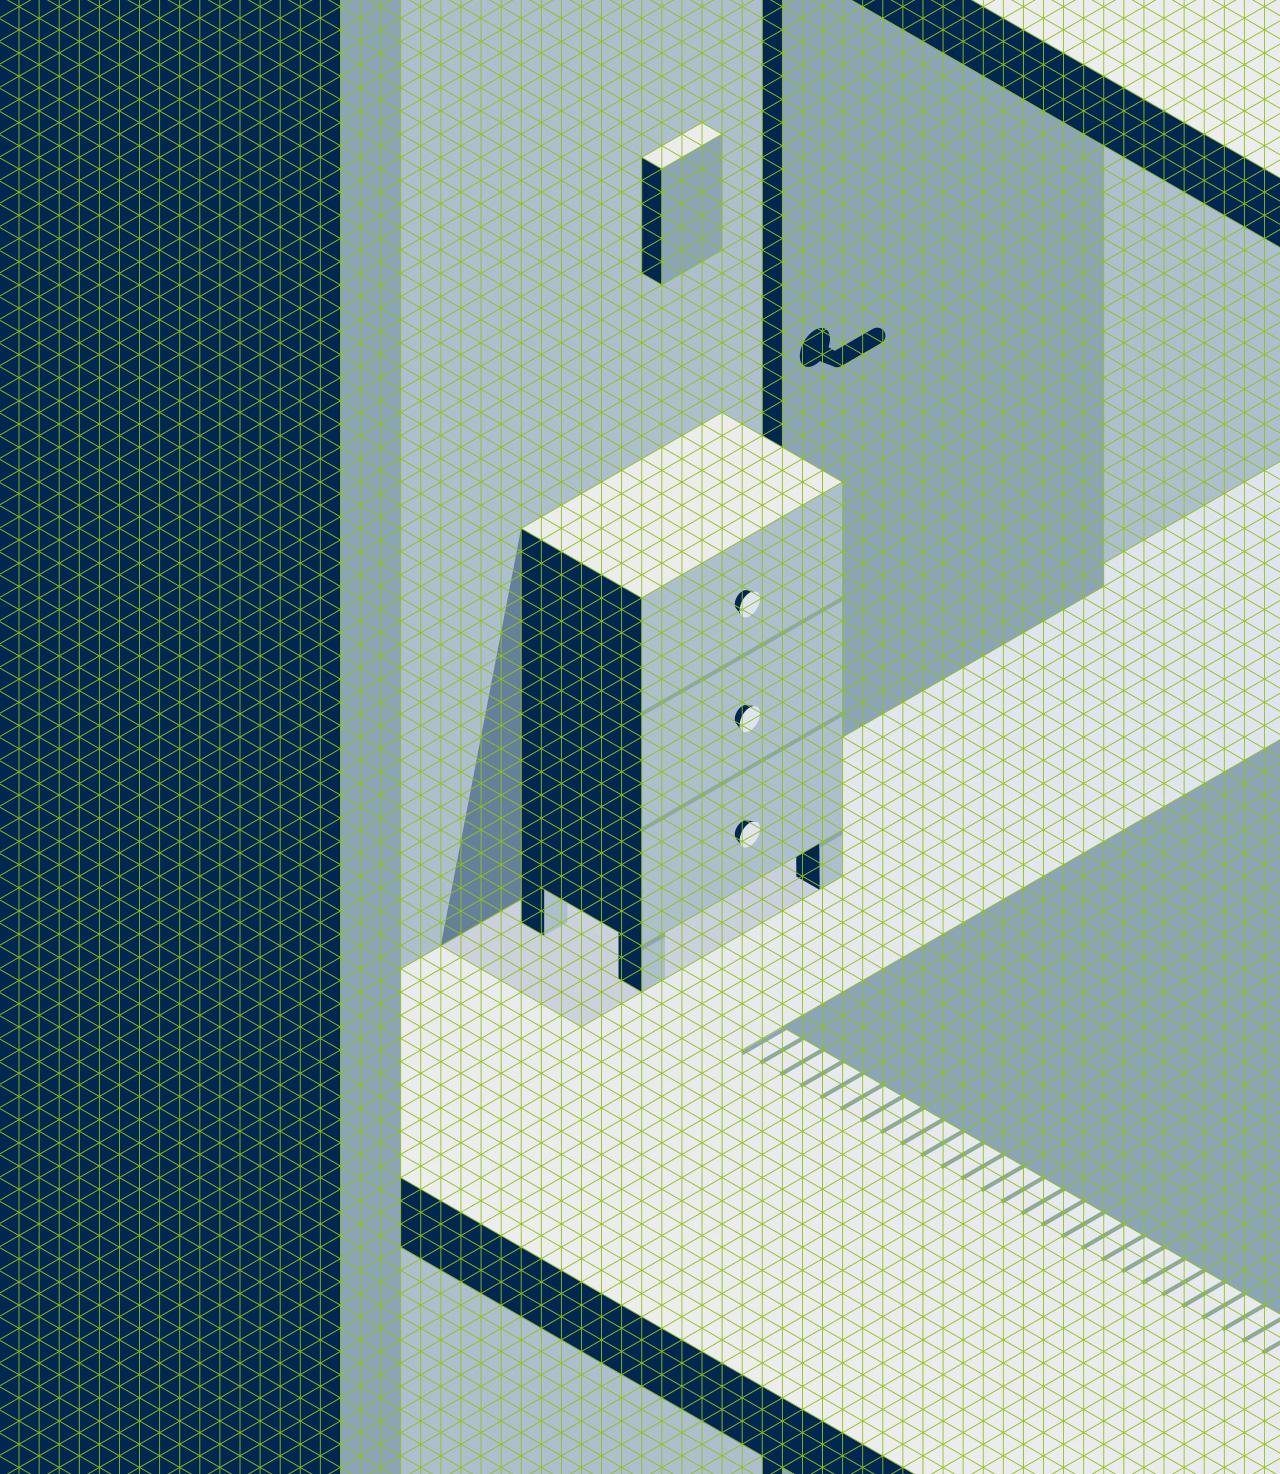
It looks like building bricks stacked one on top of the other. It’s a bit more complicated than that, but they are very well suited as a grid.
Design, infographics
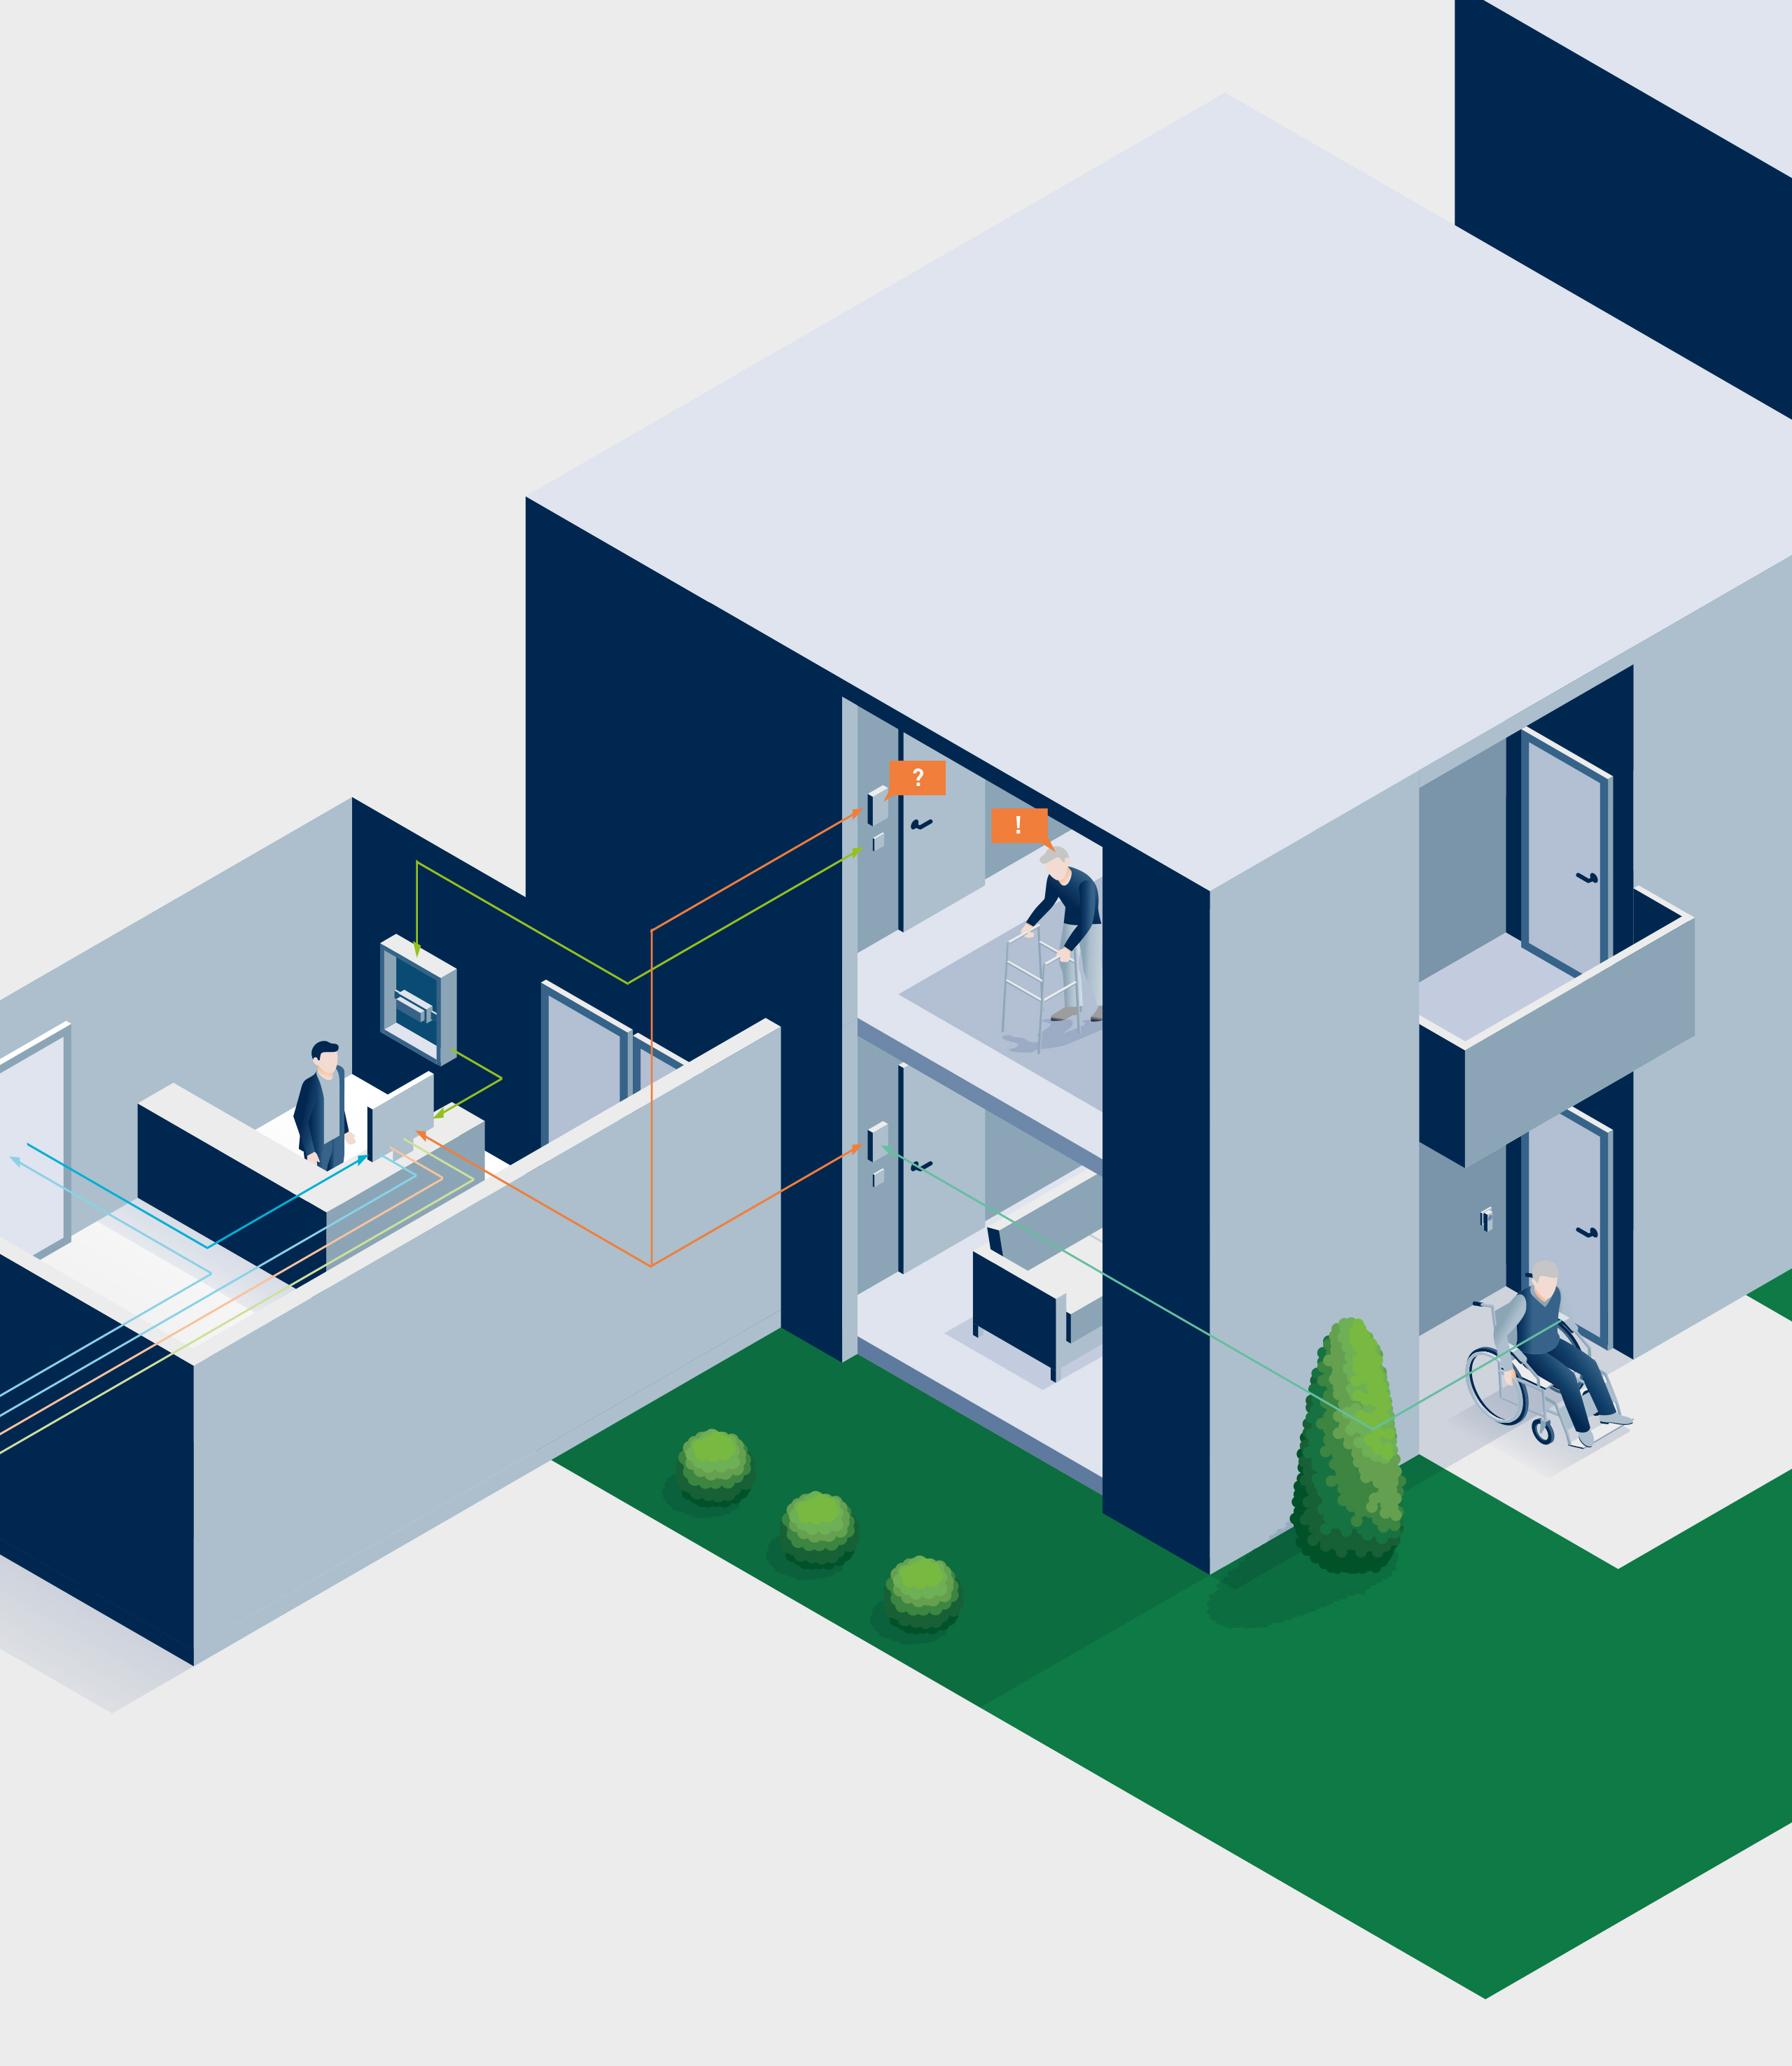
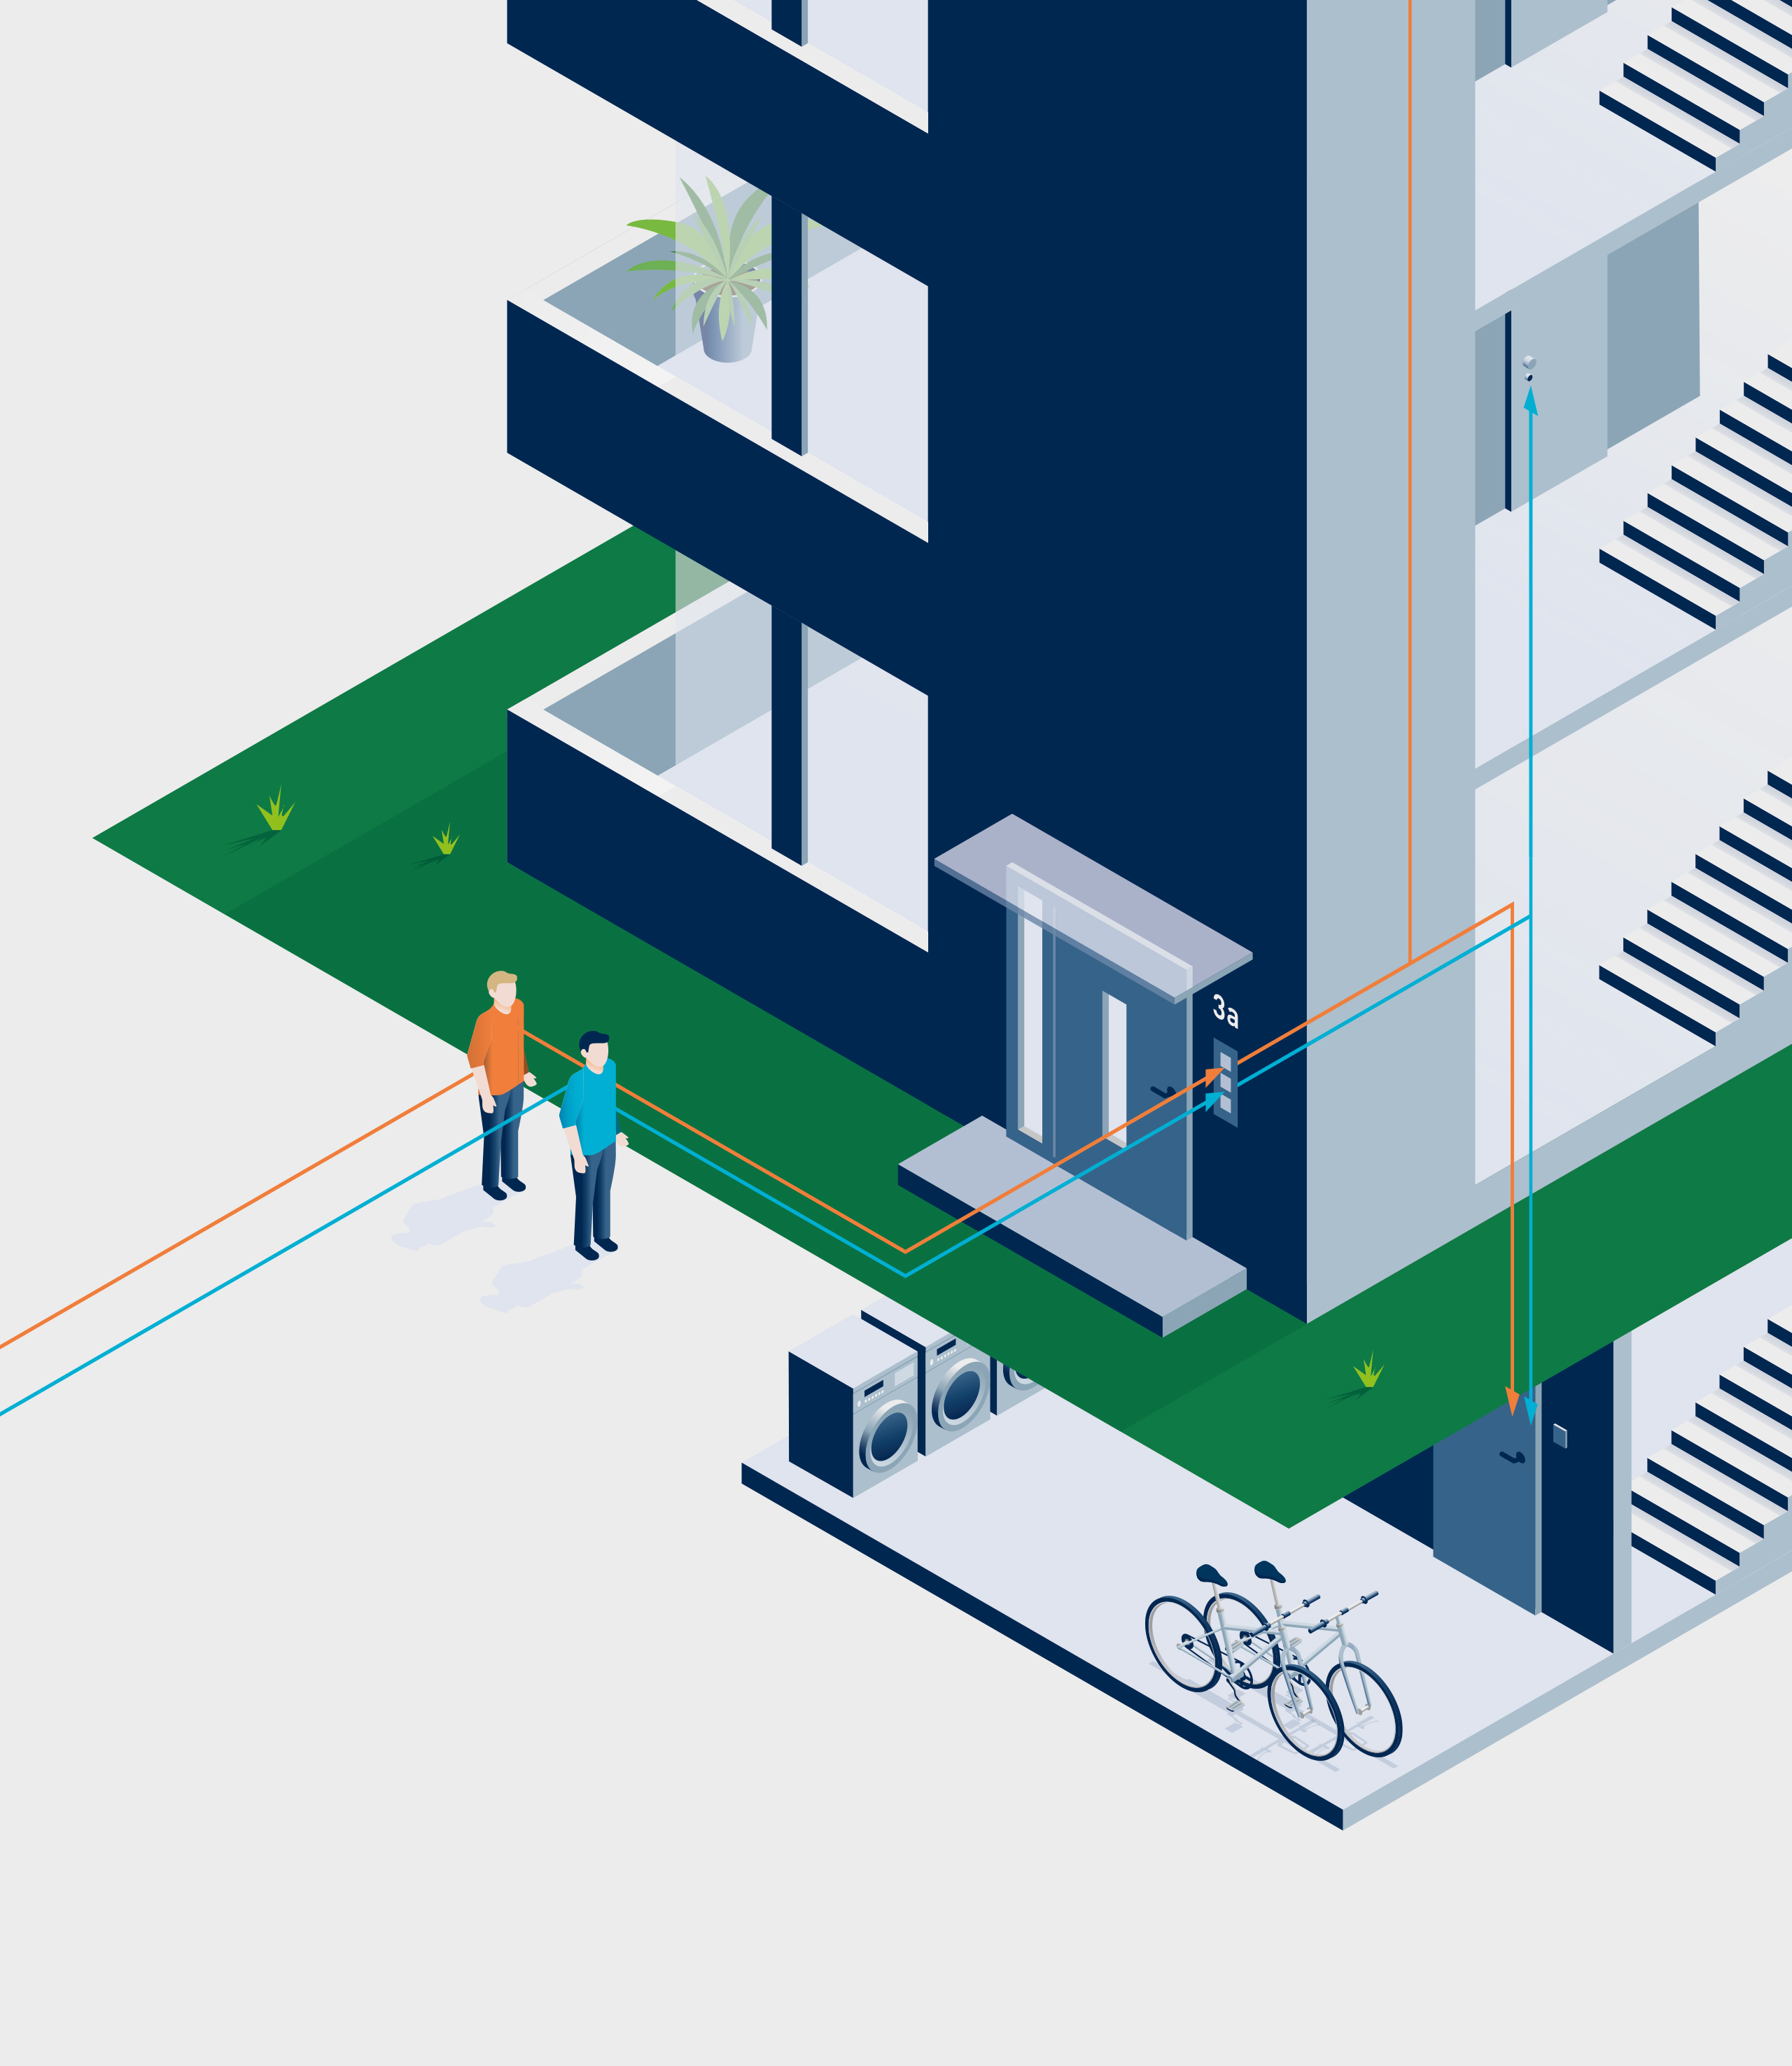
Technical systems are inherently complex and difficult for people who are not familiar with them to understand. We have visualised these complex interrelationships and technical ways of working for TCS AG. The isometric system illustrations describe various installation and communication situations in real-life application scenarios. How the TCS products and the connectivity between them work is now easy to understand at first glance even for people who aren’t trained electricians.

Well-thought-out and logically structured systematic infographics
It looks like building bricks stacked one on top of the other. It’s a bit more complicated than that, but they are very well suited as a grid.
The TCS infographics have a multi-layered structure. Whereas the illustrative layer tells a story, the application level explains how the products and systems work.

